They said, make it simple!
Ok, I just put this together over lunch, because I got the feedback that no eight year old or CEO could follow my last example post!
I want to describe this without using maths. The only nod to maths, is speaking about plotting a line on a graph that represents “Cartesian coordinates” (from our friend Rene Descartes).
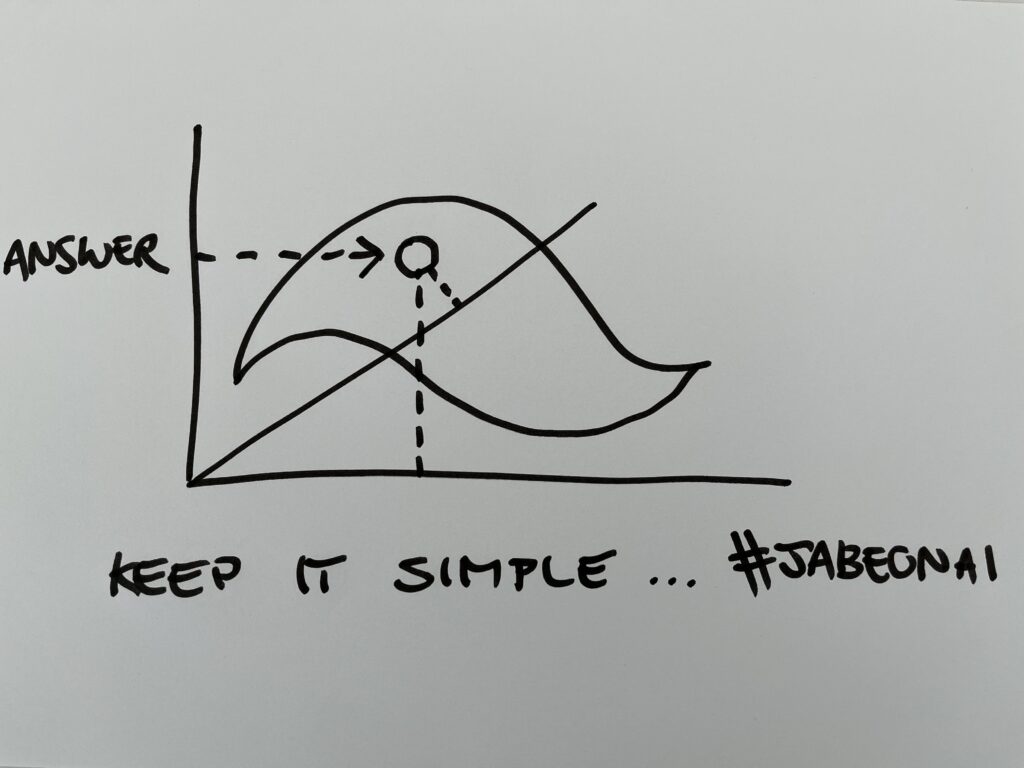
Idea 1: put it in a chart
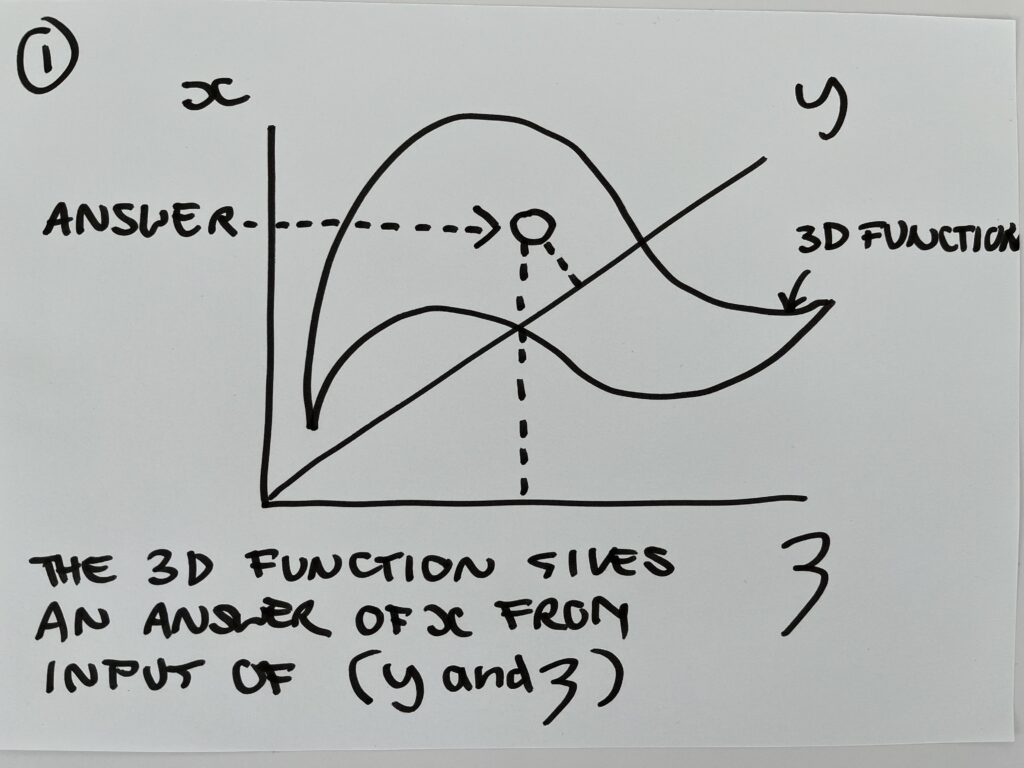
Ok so most folks have plotted a graph, think a height chart on a wall in crayon, and you could plot the height and months in two directions, now that line going through these points is called a function, and you can use it to plot measurements and make predictions of future measurements – like measuring a plant growing over time, or your kids height on the wall.
Say, you had measured your girl’s height as growing from 3 foot 2 inches in March, to 3 foot 5 inches in December, you might draw a line and predict from that line that she might have been about 3 foot 4 inches in September, say.
This is the principle on which machine learning is based, it aims to create a better and better line with better predictions, so with more measurements say in May and October, you might be able to refine your prediction to 3 foot 3 ½ inches in September.
The basic idea is that you can create something where rather than the number 3 foot 3 ½ inches, you have a longer number (made up of a series of numbers, which can be used to represent something else, such as a colour, a word, or a musical note).

Idea 2: Represent a word or idea
Once you have got your head around the idea of a kids growth chart on a wall being able to measure other things, you an think of Doctor Who the timelord, travelling in time and space, playing with not the two dimensions on the wall, but four dimensions (3D + time). And these machine learning tools go beyond 4 dimensions (think of spinal tap turning their amp up to eleven), but they can have hundreds, millions and even billions of these dimensions!
That predict really complicated things represented by a whole lot of different numbers put together (what the scientists call a vector).

Idea 3: put em together
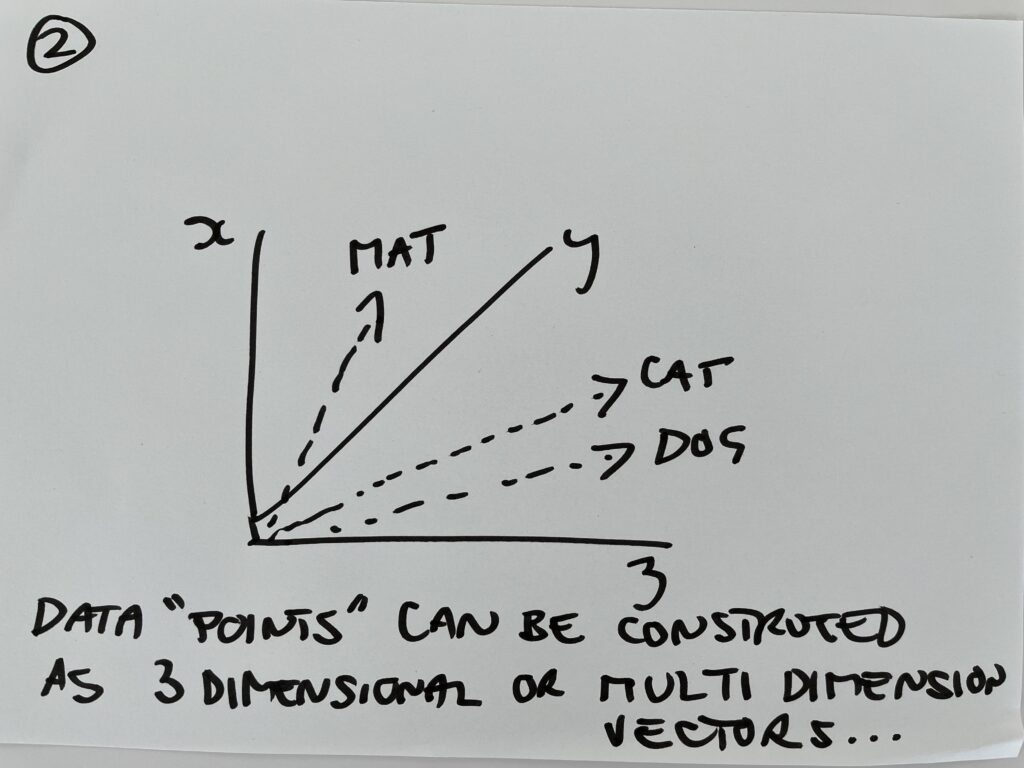
One of the things you can represent with these long strings of numbers, is not just your child’s height or the month of the year. You can represent words (or ideas) as arrows say in a 3D space – and the direction they are pointing in says how similar they are, so for example the ideas of cat and the idea of dog roughly point in the same direction, but the idea of mat points in quite a different direction (because it is not alive, and doesn’t have hair which you can think of as being directions in this space – things alive to the left, things not alive to the right).

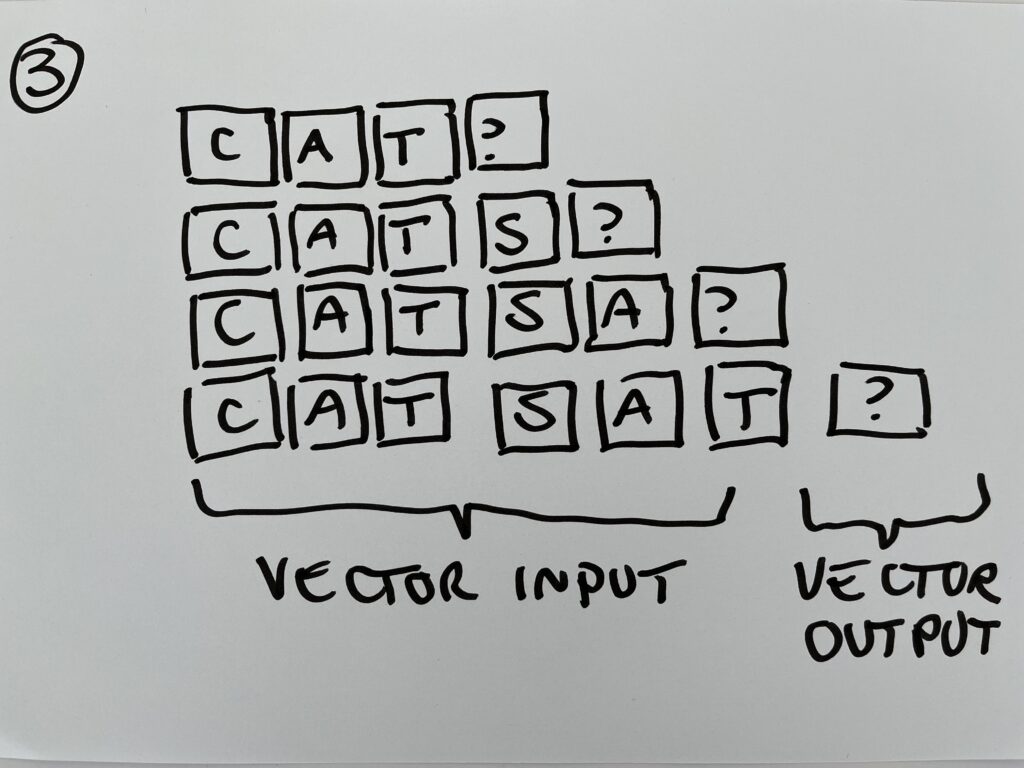
Now these lines that we have used to make predictons – (like the one we have used to plot the height of your child each day of the last 6 year), or the one we used for plotting a line to judge if you new concept of dog is closer to cat or mat (3D line is a surface like a tablecloth) – can be used for making choices rather than predicting a number, of classing a thing as like another – such as what would be the next letter in this series of letters based on the books I have trained the system on before.
So, for example, based on all the books in the school library, which of these two sentences would be most likely?
- The cat sat on the mat?
- The cat sat on the dog?
You can train a neural network with a number of examples of sentences, that in a 3D space (or multi D space) point in different directions just like, cat, dog and mat. The line or tablecloth can tell you, by ‘looking up’ your answer, just as how tall was our daughter in September, or which word is most like cat, dog or mat? You can also say, give me the next word “the cat sat on the”
And you have got yourself a shiney new #ChatGPT system! Simples. #JabeOnAI